 Yes, I’m going to stick my neck out here and identify this as “THE BOTTOM” of the down market trend for the East End since 3rd Quarter 2005, which marked the peak of activity for the number of home sales, while certain segments of the market continue appreciating for another 18 months. Having been a student of these markets for almost 30 years, identifying changes and trends is always interesting. The stock market crash of 1987 didn’t hit full impact on the East End until 1990, thus 3 years of downward trend followed by 18-24 months of clawing our way to a healthy, balanced market. Two recessions and several advances later, we find ourselves establishing a floor to the worst correctionary market I’ve ever experienced. A floor is established when prices begin to find their new levels.
This Town&CountryMarket Report, 2nd Quarter 2009, actually reflects 1st Quarter activity.As mentioned in prior reports, Real Estate market analysis has a 3 to 6 month delay from the actual sales activity. Once again, this is due as a result of the time from the O&A (offer and acceptance); to contract issuance; then signing; followed by due diligence (i.e. survey, title, C of O update, mortgage approval); then, the actual closing of title followed by the recording of title transfer – after which, I can finally analyze the data and bring you the report- 3-6 months later, which is vastly different than business reports from retail sectors which is easily tracked within days.
Being in the trenches daily gives me additional insight into lead activity, which precedes the O & A activity- all of which is factored into my assessment of this as the “THE BOTTOM”
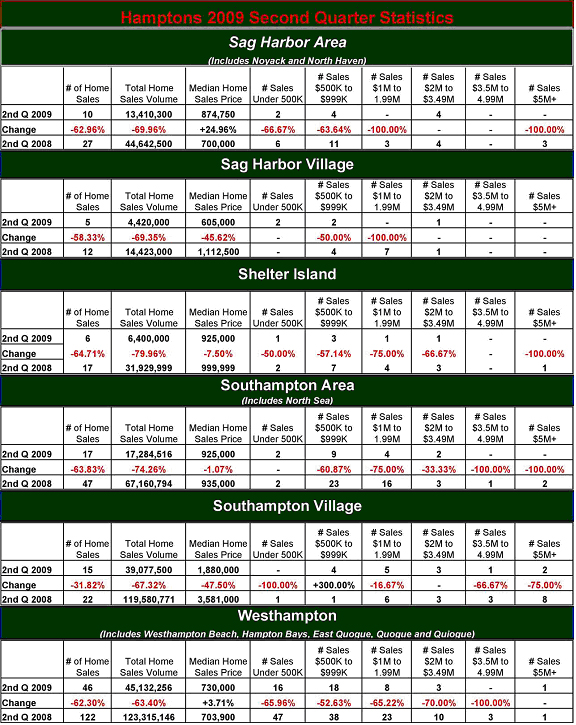
Town & Country’s 2nd Quarter 2009 Hamptons Report demonstrates the continued loss of activity with declines in the Number of Home Sales from -32% in SOUTHAMPTON VILLAGEto as much as –65% on SHELTER ISLAND.
SHELTER ISLANDseemed to experience an extended frigid winter with the greatest loss in Number of Home Sales (-65%, from 17 in 2008 to 6 in 2009) as well as Total Home Sales Volume (-80% from $32M to $6.4M) but only a – 7.5% drop in Median Home Sales Price. Looking back at Town & Country’s 2007 Report there were 25 sales in the 2nd Quarter 2007, but the Median Home Sales Price was $775,000, showing that while activity levels may have experienced steep declines, investing in SHELTER ISLAND was still a very wise investment.
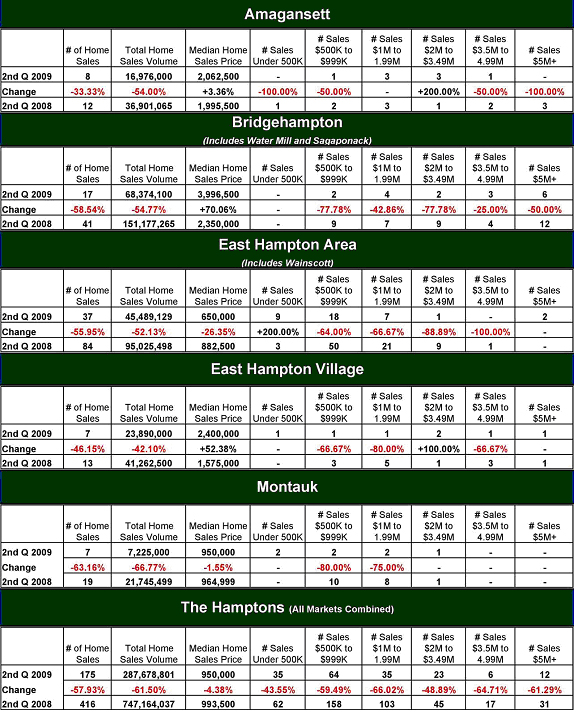
Notice 5 of 11 markets mentioned in Town & Country 2nd Quarter 2009 report actually saw increases in Median Home Sales Price— quite a phenomenon.
BRIDGEHAMPTON (includesWaterMill and Sagaponack) actually shot up inMedian Home Sales Price from $2.35M in 2nd Quarter 2008 to $4M in 2nd Quarter 2009 (and was $2.65M in 2007)—very impressive! BRIDGEHAMPTON (includes Water Mill and Sagaponack) takes the crown for the highest Median Home Sales Price in the Town & Country 2nd Quarter 2009 Housing Report at $4M.
Alook at all HAMPTONMARKETS COMBINED and we see the glacial shift. The Number of Home Sales dove 58% from 416 in 2008 to 175 in 2009 (it was 622 in 2007), while the Total Home Sales Volume fell 61.5% from $747M in 2008 to $288M in 2009 (BTWit was $1.25B in 2007). Clearly, this is the “THE BOTTOM”.
Fortunately, each Town&Countryoffice in the Hamptons has been reporting sales appointments, O &A’s, contracts, and closings since May— so Town & Country’s 3rd Quarter 2009 will look better than this one— I promise!
To view more specifics on your particular locations and price ranges visit our website 1TownandCountry.com and click on “Reports”.


