By Tim Estin with Coldwell Banker Mason Morse
The Estin Report: June 2012 Aspen Snowmass Market Snapshot by Tim Estin with Coldwell Banker Mason Morse
Aspen Snowmass real estate monthly sales statistics and under contract activity for all Aspen, Snowmass Village, Woody Creek and Old Snowmass properties over $250,000 in the upper Roaring Fork Valley excluding fractionals.


Click here for the full report:
Summary Comparison & Comments
June 2012 vs June 2011
(Now vs Then, Year over Year)
Total Aspen* Snowmass Market
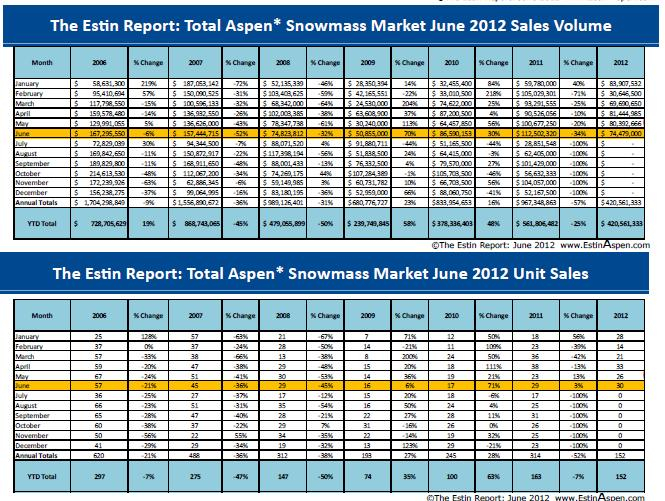
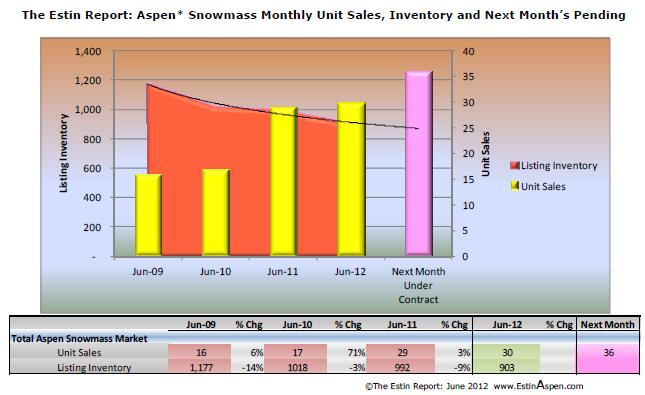
• Monthly Unit Sales: up +3%, 30 sales now vs 29 sales then
• Year-to-Date Unit Sales: down –7%, 152 sales now vs 163 then
• Monthly Dollar Volume: down –34%, $74M now vs $113M then
• Year-to-Date Dollar Volume: down -25%, $421 now vs $562M then
• Listing Inventory: down –8%, 1,160 properties for sale now vs 1,262 then
Aspen* Market
• Unit Sales: up +15%, 23 sales now vs 20 sales then
• Year-to-Date Unit Sales: down –3%, 111 sales now vs 115 then
• Monthly Dollar Volume: down –12%, $66M now vs $75M then
• Year-to-Date Dollar Volume: -23%, $351M now vs $455M then
• Listing Inventory: down –11%, 613 properties for sale now, 692 then
Snowmass Village Market
• Monthly Unit Sales: down –22%, 7 sales now vs 9 sales then
• Year-to-Date Unit Sales: down -15%, 41 sales now vs 48 then
• Monthly Dollar Volume: down –77%, $8.6M now vs $37.3M then
• Year-to-Date Dollar Volume: down –35%, $70M now vs $107M then
• Listing Inventory: down –4%, 287 properties for sale now vs 299 then
June 2012 Sold Properties Links (Links to property details and photos are valid for 30 days until 07/31/12)
· Aspen Residential Solds June 1-30, 2012: (over $250,000) - (18 solds)
· Aspen Lots Sold (includes SMV & Woody Creek) June 1-30, 2012: (over $250,000) (5 lots sold, none in SMV)
· Snowmass Village Residential Solds June 1-30, 2012: (over $250,000) - (7 solds)
Comments
Differences in 2012 YTD over 2011 YTD Narrowing: Although the June 2012 numbers continue to be off for the year, the differences year over year YTD in total unit sales (-7%) and total dollar volume (-25%) is narrowing especially most recently. In early June 2012, there were two noteworthy sales events: 1) The Prince Bandar Starwood estate closed at $49MM; 2) A 2008 built Maroon Creek riverfront estate, on the market since June 2007 at ask price $29.95M went under contract last week and is scheduled to close mid-July. These two sales will bring the year's total sales dollar volume closer to last year. Also of note, the total Aspen Snowmass inventory of properties for sale has decreased –26% since June 2009. The trend of improving sales with less product to choose from continues although at a slow pace similar to housing trends outside the Aspen Snowmass valley.
Lack of Big Ticket Sales in 2012: The deficiency in total dollar sales for 2012 YTD is largely due to the lack of 'big ticket', $10M+, property sales in the first 6 months of this year. In the over $10M sales category 2012 year to date, there have been 2/3 less sales, or down -67%, over last year to date: From 1/1/12 - 6/30/12, there were a total of (5) single family homes sold in the $11.5—$16M range of which four homes were built 2005 or newer; from 1/1/11 - 6/30/11, there were (15) sales in the $11M—$20.5M range of which eight were built 2005 or newer...This also illustrates that newer built homes, at post-recession reset prices, have been selling well. There may be more to the fall in dollar volume than the pullback of ultra-expensive sales in the first half of the year over first half 2011, and The Estin Report will review more on prices in the soon to be released State of the Aspen Market 2nd Quarter/1st Half 2012 Report.
Land Sales Surging: Also, there has been the dramatic spike in vacant lot sales in June 2012 over June 2011, on top of gangbusters land sales for all of 2012 YTD. o In June 2012 alone, there were (5) lot sales versus none (0) in June 2011; in the first half 2012, there were (22) vacant lot sales versus (9) in the same period last year, +144%. o The dollar volume for land sales has also surged +278%: in 1st Half 2012 land sales totaled $57M versus $15M during same time last year. o If one counts the sale of older 'teardown' homes as land sales in the first half of 2012, the difference in vacant lot sales this year over all of last year is even more pronounced, over +200%.
In its June 11, 2012 blog post, the Estin Report wrote, “In the last two years, [I have] consistently written that the best values are in land and that, in many circumstances, optimum value can be achieved through purchasing land and building new as land values, generally, have dropped sharply from pre-recession peaks and construction costs came down considerably, at least for a period. But building activity is increasing and costs are rising. Add to the pressure on land sales now is the fact that newer built developer inventory from 2007-2012 is largely sold-out, with only a few new-built properties remaining.” Typically, when land sales start to pick up, it is an important marker of a market transition, a tipping point.
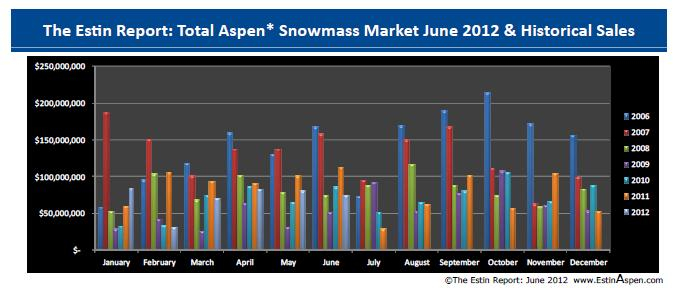
Late Summer Rallies: Historically the strongest sales of the year generally occur in August, September and October, and one of the weakest months is July...March and April are also strong. Let's hope for an end of summer rally.. (Refer to Page 4 in Monthly Snapshot for the Aug - Oct market spike.)
List of June 2012 Aspen Market Snapshot Charts and Tables
- The Estin Report: Total Aspen* Snowmass Market June 2012 YTD Dollar Sales Historical Yearly Comparison Chart - Page 4
- The Estin Report: Total Aspen* Snowmass Market June 2012 YTD $ Sales Yearly Comparison Table - Page 4
- The Estin Report: Total Aspen* Snowmass Market June 2012 YTD Unit Sales Yearly Comparison Table - Page 4
- The Estin Report: Total Aspen* Snowmass Market Monthly Sales June 2012 - Page 5
- The Estin Report: Aspen* Monthly Sales June 2012 - Page 6
- The Estin Report: Snowmass Village Monthly Sales June 2012 - Page 7
